

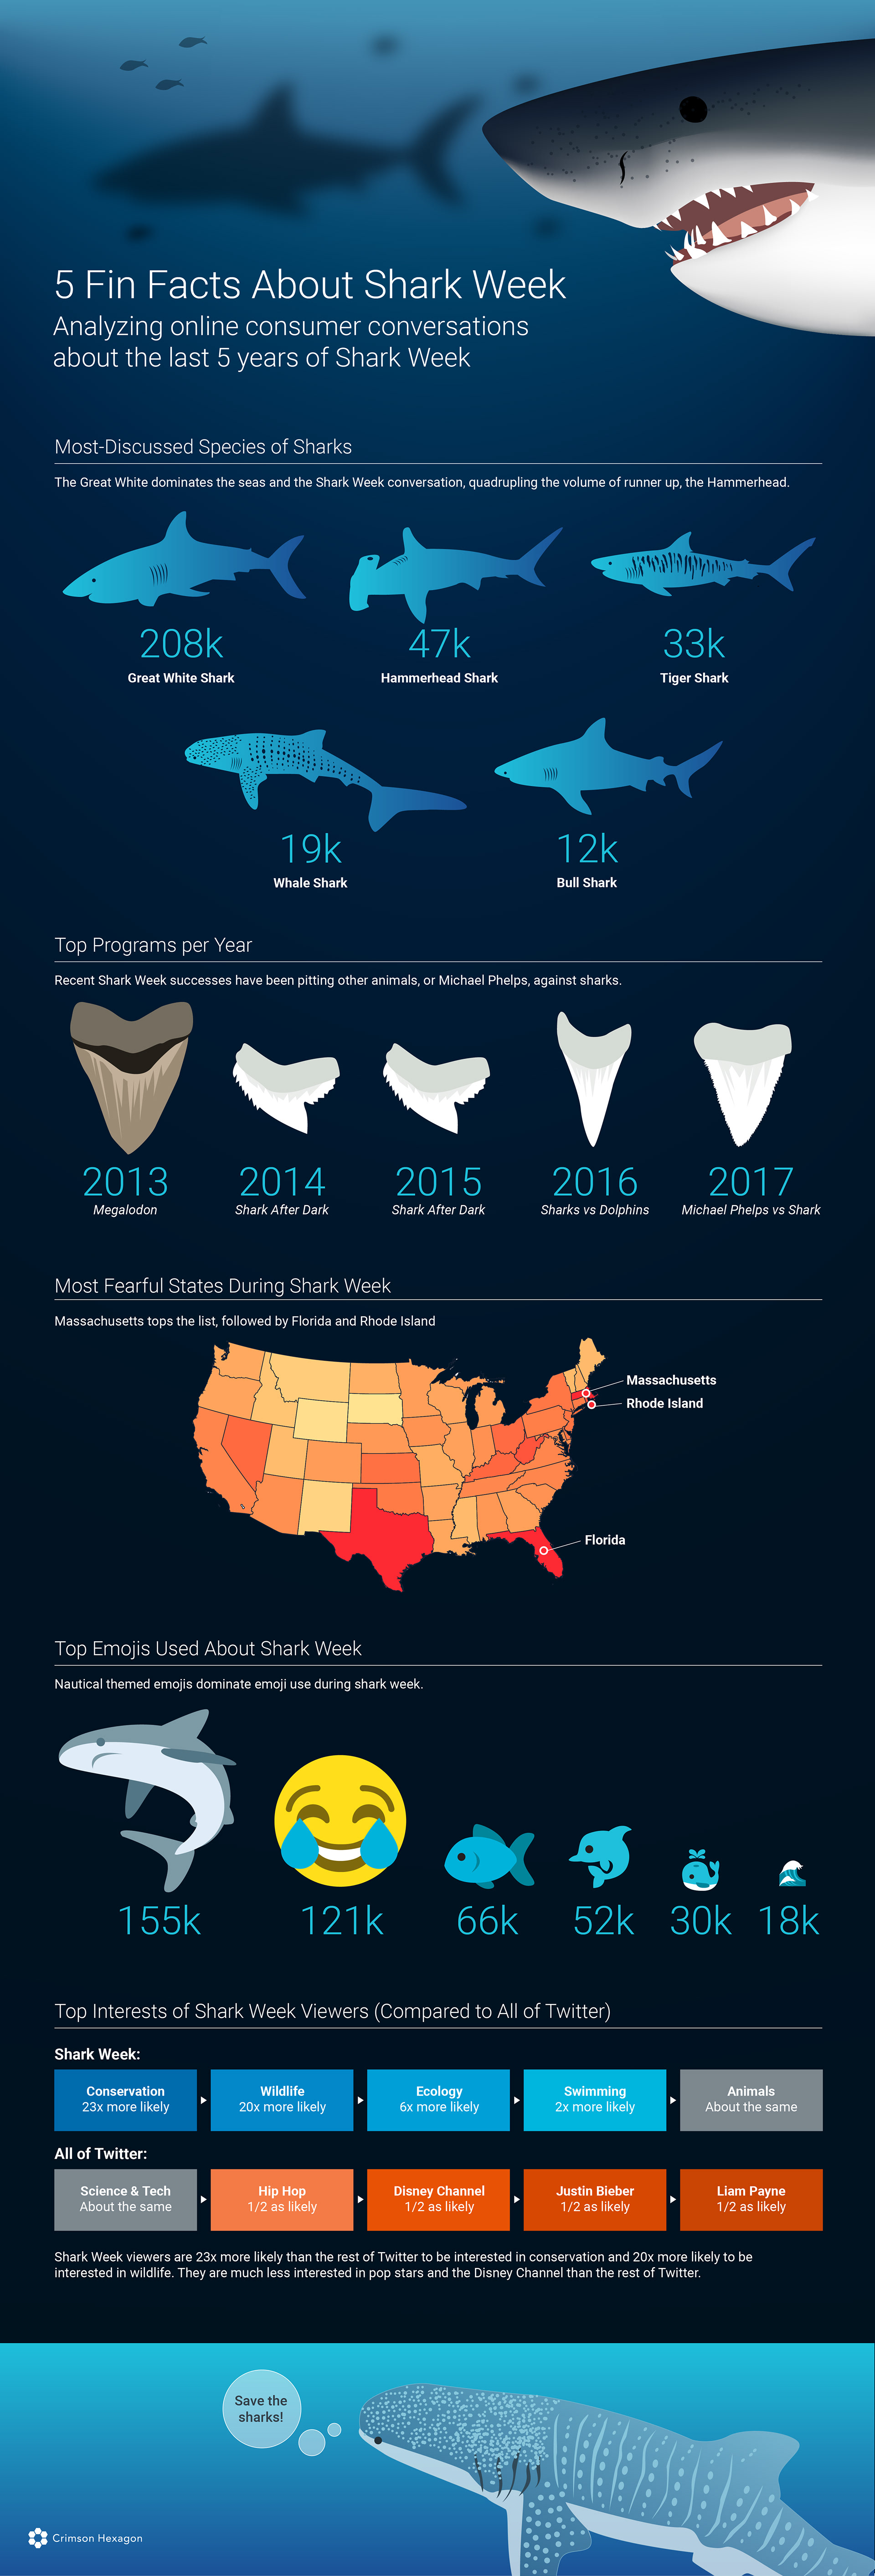
I love sharks. I was so excited to work on this because I asked "can I draw tons of sharks?" and was told "yes," so I drew tons of sharks. Perhaps unsurprisingly, discussion is highest in the states with the largest great white populations (MA and RI, the land of Jaws) and the state with the most attacks (Florida, with its many beaches and year-round warm temperatures).
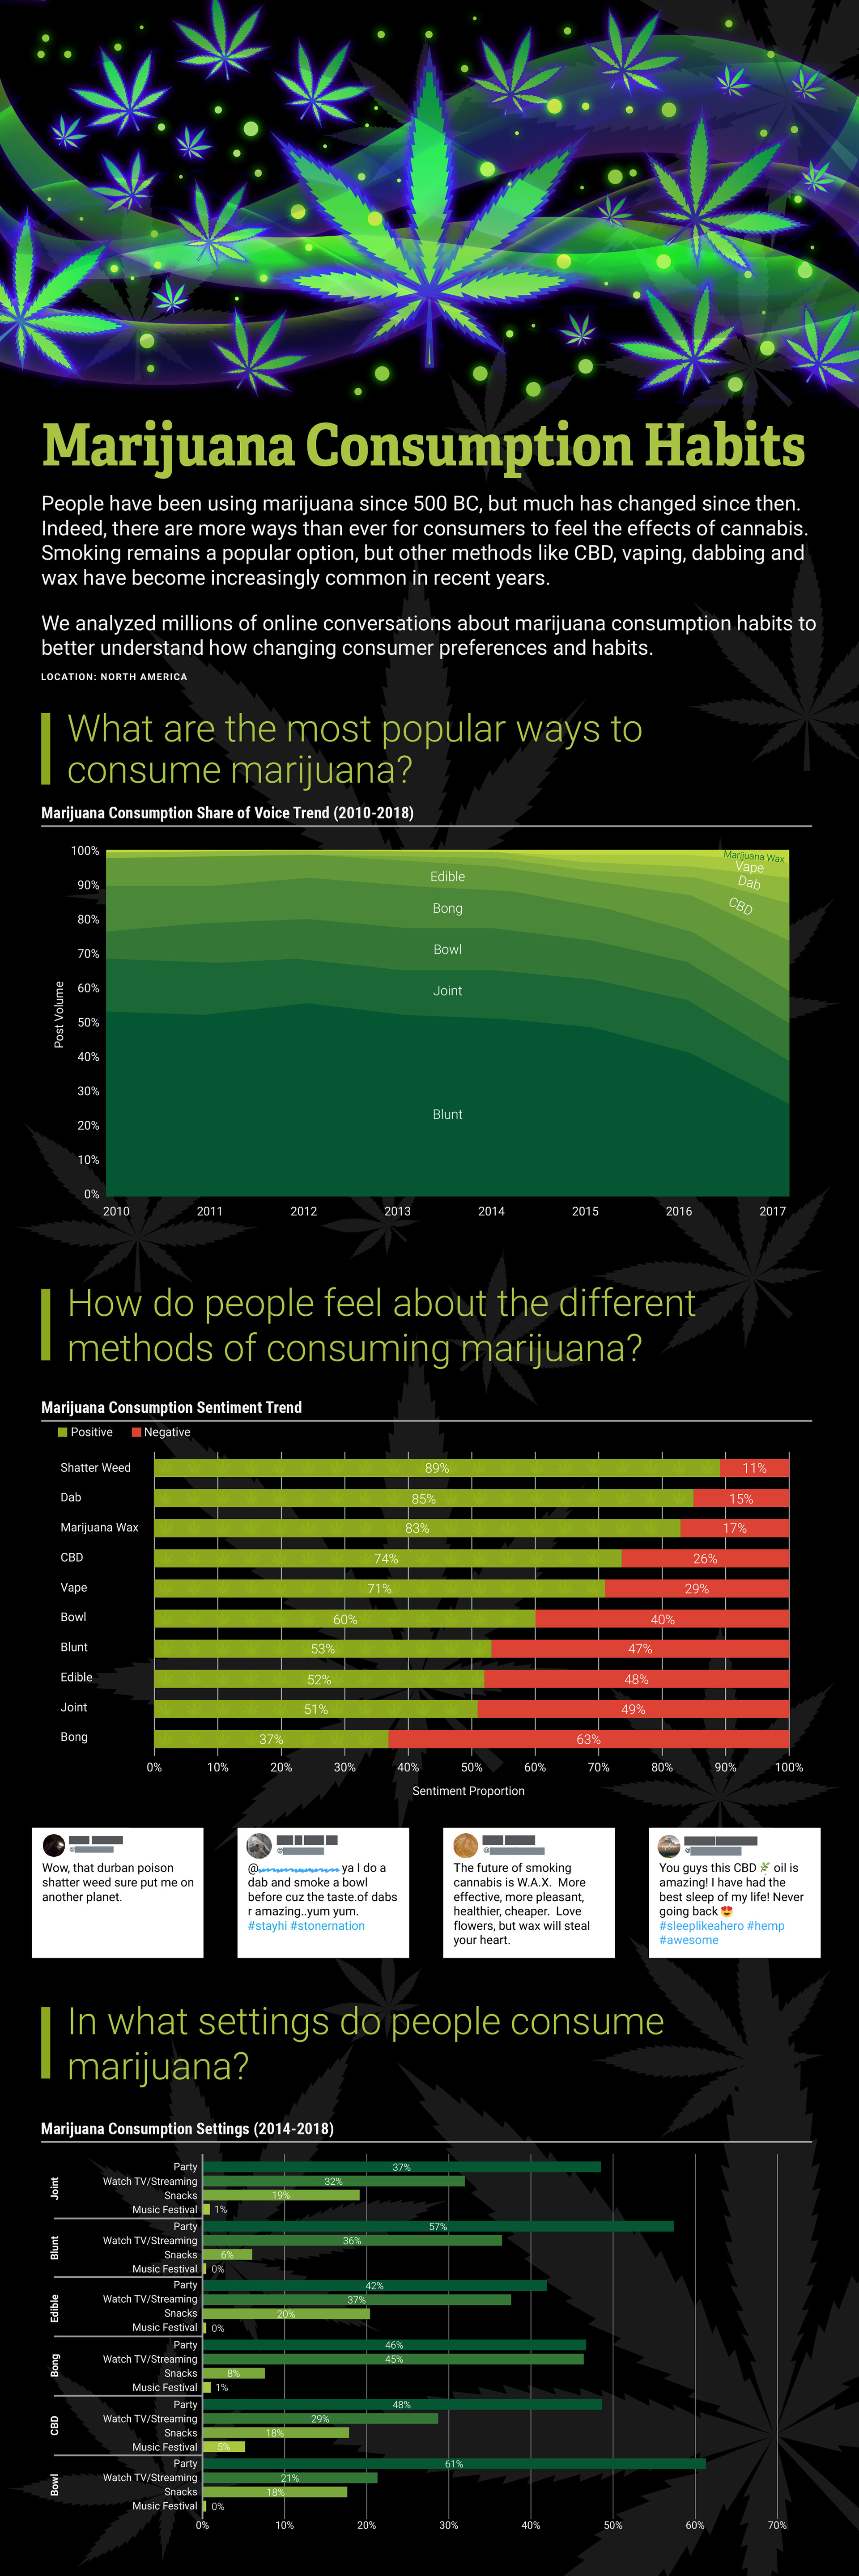
I wanted to create an infographic that was part informative, part "blacklight poster at the back of a Spencer's Gifts circa 1998." Marijuana is an interesting topic, and oftentimes a very loaded one. This particular analysis was a bit lighter, focusing more on consumption habits and peoples experiences with weed.
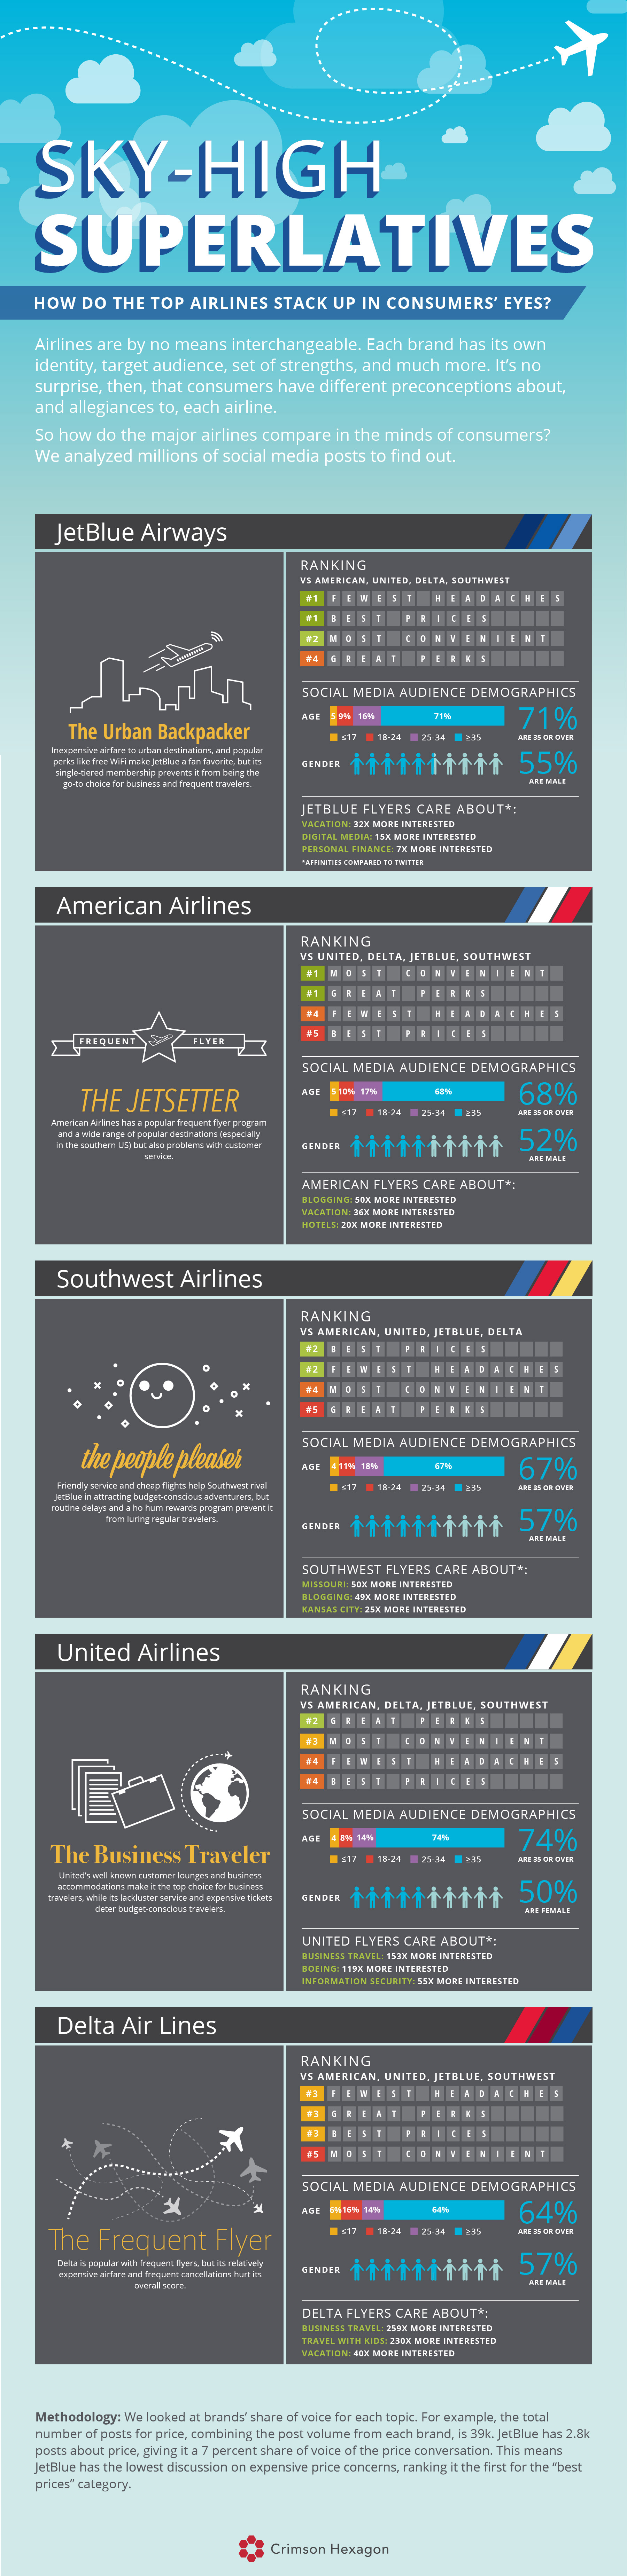
Information about the airlines industry, designed to resemble airport flight display boards.
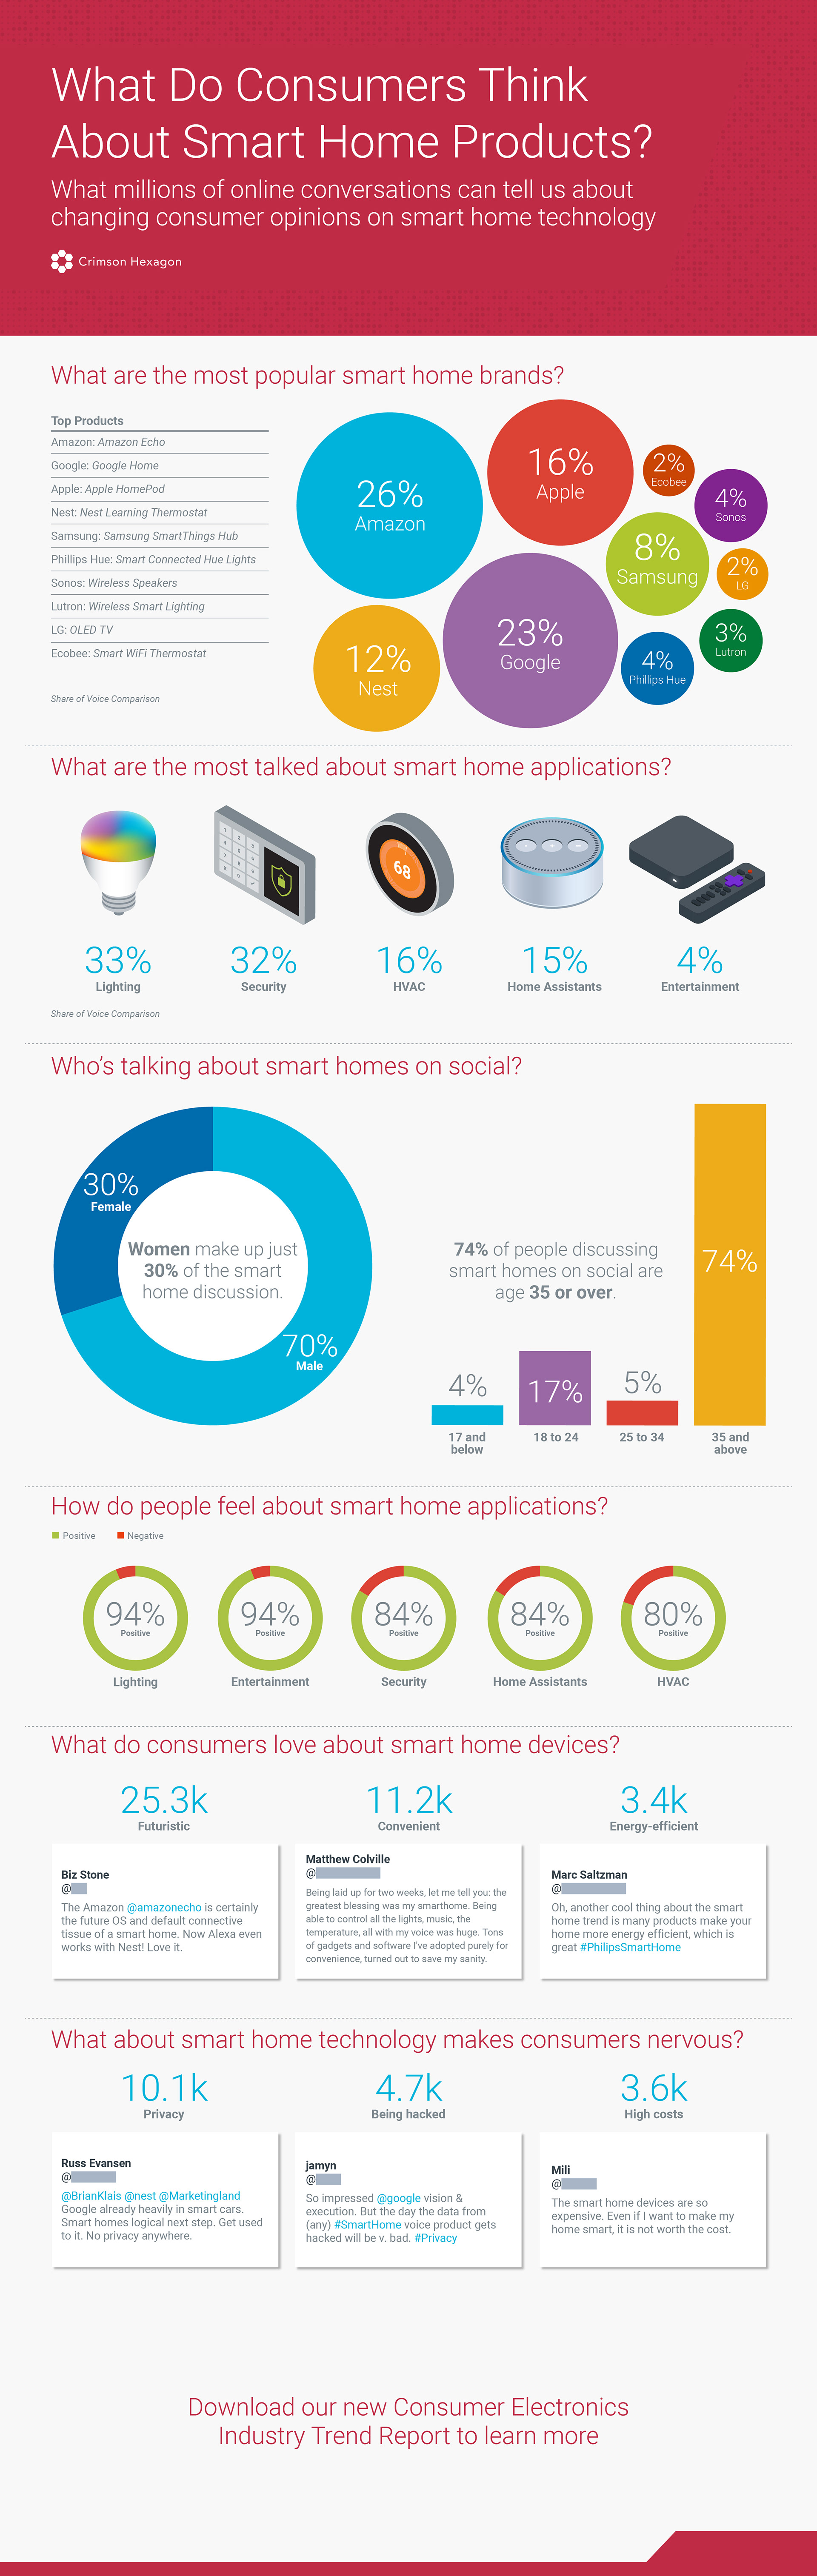
Infographic about consumers thoughts about smart home devices. Convenient gadgets, or devices for spying on us? Consumer electronics are becoming smarter and capable of more complex tasks, but also seem to creep further and further into our lives. I love drawing in the isometric style; it's challenging but the end result is always worth the extra time.
Infographic with data about McD's. This is one of the most fun projects I've had the opportunity to work on: providing insights into a restaurant I had eaten at dozens of times over the years, but never especially considered their social media presence. I thought the infographic would be pretty boring with just charts, so I included plenty of illustrations to add interest. Let's hope McSushi never becomes a reality.
You might love burgers. But you will never love burgers as much as the man who ate twenty-five THOUSAND Big Macs. It's a pretty impressive feat, hence the religious-icon-esque burger imagery. With the data, it's interesting that despite how large of a company it is, and how often new products are released, there's a huge gap in notable events between 2011 and 2016.